
I have seen something else under the sun:
The race is not to the swift
or the battle to the strong,
nor does food come to the wise
or wealth to the brilliant
or favor to the learned;
but time and chance happen to them all.
~ Ecclesiastes 9:10-12
The writer of Ecclesiastes probably didn’t have hockey in mind when he wrote those words thousands of years ago, but he still nailed a timeless truth that applies to the fastest game on earth: time and chance happen to them all.
In hockey, we can apply those words in two ways: we can look at how players, even the best players, decline as they age. That’s time. We can also look at how randomness can affect a player from season to season. That’s chance. Let’s look at the latter for now, because contemplating the inexorable passing of time gets depressing.
Chance can impact a team and its players in multiple ways. One way is via health. We've seen how injuries can bring down even the greatest Canucks team ever constructed. When it comes to a team where everything has to go right just to make the playoffs, injuries can be even more impactful. That said, it's hard to keep using injuries as an excuse when they seem to happen every year.
Another way that chance affects a team is via bounces on the ice. Hockey is played with a small rubber disc on an inherently slippery surface. Small deflections can make a big difference, causing a puck to go bardown or miss the net entirely. A puck can accidentally roll off a forward's stick as he shoots and fool a goalie or a shot labeled for the top corner can carom off the knob of a goalie's stick and out of play. Skill certainly matters, but we see random chance affect hockey every time we watch a game. That's part of what makes it so fun to watch, as it's so unpredictable: anything can happen in a game and an underdog can pull off a massive upset.
We can look at the impact of this type of chance with a statistic called PDO. Yes, that old chestnut.
As a refresher, PDO isn’t an acronym, but a reference to the username of the guy that came up with the statistic. That makes it a terrible name, but still a useful statistic.
The NHL refers to PDO as SPSv%, which stands for Shooting Plus Save Percentage. That makes it a more accurate name, but not a particularly catchy one. That’s all that PDO is: an addition of shooting percentage and save percentage at 5-on-5. A player’s PDO is specifically the shooting and save percentages of the team when that player is on the ice at 5-on-5.
Since a shot on goal has just one of two outcomes — a save or a goal — the league average for PDO comes out to a nice round 100%, generally written as 1.000. In other words, 100% of all shots are either saves or goals.
The key point is that if a team or player’s PDO is significantly above or below 1.000, it is likely to regress to the mean in the future. That means players and teams tend to move towards a 1.000 PDO over time. It doesn’t mean they’ll hit exactly 1.000, just that they’ll tend towards that over time.
This may sound counterintuitive: doesn’t a team or player’s on-ice shooting percentage or save percentage reflect their skill? Well, to a certain extent, yes. The impact of skill on such percentages is just a lot lower than you might expect.
Looking at just the last two seasons, we can see that an individual player’s PDO in 2017-18 had essentially no predictive power for their PDO in 2018-19. In other words, having an exceptionally high on-ice shooting and save percentages in one season didn’t make players any more likely to repeat that performance the following season. That’s exactly what we would expect for a statistic likely to regress toward the mean.
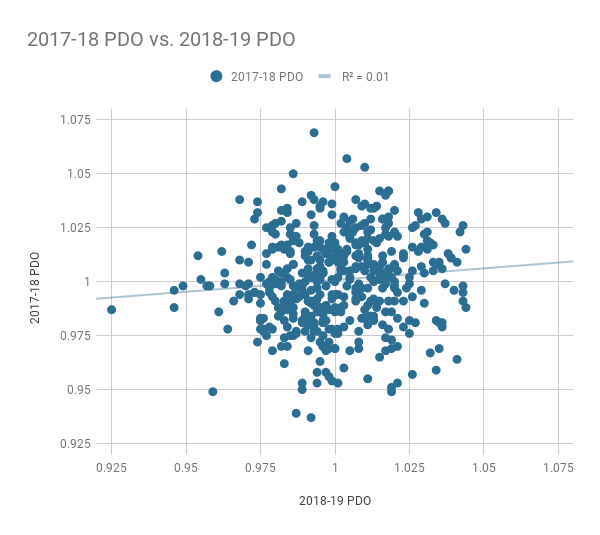
The R-squared value on the graph essentially means that the previous season’s PDO explains about 1% of the current season’s PDO (that’s a very simplified explanation of R-squared, please don’t write me letters). If players could exert a high degree of control over on-ice shooting and save percentages, we would expect that to be a lot higher.
As a concrete example, we can look to one of the outliers on the chart above. The top dot is Auston Matthews, who posted a 1.069 PDO in 2017-18 on the back of both higher-than-average on-ice shooting and save percentages. That’s 3.3 standard deviations above the league average, which is insanely high.
In 2018-19, Matthews not only couldn’t keep those percentages that high, he actually had a .993 PDO, below league average. His on-ice shooting percentage was still a bit above average, but his on-ice save percentage was below average: his goaltenders didn’t make as many saves when he was on the ice.
We can split up PDO into its component parts to get a better picture of how this works. If we look at on-ice save percentages, we can see that there is essentially no connection from season to season.
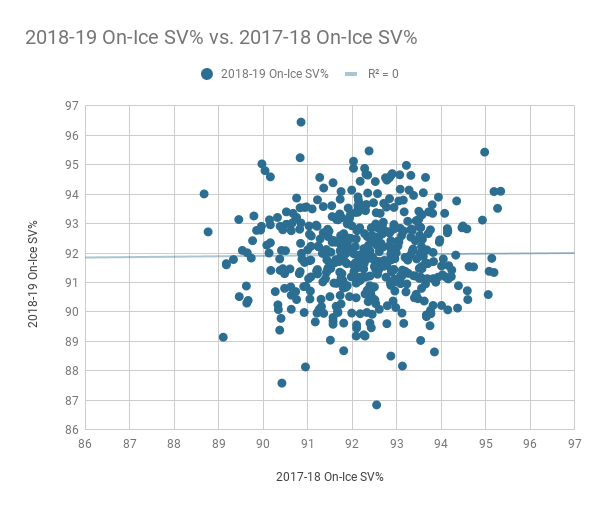
This strongly suggests that skaters, generally speaking, have a very limited influence over whether goaltenders make a higher percentage of saves. Or, if a player can consistently influence a goaltender’s save percentage, they’re a rare unicorn and should be cherished forever. Or drop-kicked, if they consistently influence it in a negative fashion.
If we look at on-ice shooting percentages, however, we do see a slight positive correlation from season to season.
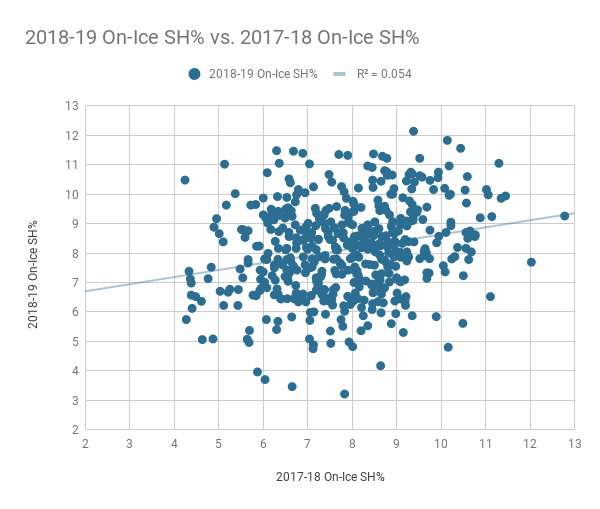
It’s slight and on-ice shooting percentages still look fairly random from season to season, but it’s there.
At the same time, you see some wild swings in on-ice shooting percentages. In the top left corner, we see Nic Dowd, who had the NHL’s worst on-ice shooting percentage in 2017-18 among skaters with at least 500 minutes at 5-on-5. Those minutes were with the Canucks, so fans are well aware.
Last season, however, with the Washington Capitals, Dowd’s on-ice shooting percentage jumped up to 10.48, well above average. His PDO went from .968 in 2017-18 to 1.041 in 2018-19. That’s 2.14 standard deviations above average, so most likely it will come back down next season.
At the very bottom of the chart is Tobias Rieder. He had a 7.83 on-ice shooting percentage in 2017-18, just a hair below league average. The Oilers signed him, expecting some secondary scoring: instead his on-ice shooting percentage plummeted to a league-low 3.21 and he didn’t score a single goal.
That led the Oilers’ Bob Nicholson to throw Rieder under the bus at a season ticket holder’s event, saying that if Rieder had scored 10-12 goals, the Oilers would have made the playoffs.
Remember, we’re not talking about an individual player’s shooting percentage. Players have an influence on their own shooting percentage based on their shooting skill and ability to get chances from dangerous areas on the ice. The likes of Brock Boeser and Elias Pettersson are likely to have an above-average shooting percentage, even if it fluctuates from season to season due to chance.
When it comes to on-ice shooting percentages, that influence is lower. A player can set a teammate up for an open net, but still see their teammate shoot the puck back into the goaltender. A few years ago, TSN’s Travis Yost found that defencemen have essentially no influence on on-ice shooting percentage, wingers have a small influence, and centres have the most influence, albeit still somewhat limited.
With all that in mind, and it’s a lot, let’s look at how the Canucks performed in 2018-19 when it comes to on-ice shooting and save percentages, and their combined PDO.
The Canucks had a .994 PDO overall, 19th in the NHL. In other words, chance didn’t particularly favour them, but they weren’t extraordinarily unlucky either. Their shooting percentage at 5-on-5 was 7.75, below the league-average of 8.05, and their save percentage was .916, below the league average of .919.
I’ve coloured the chart by whether a player’s number is above or below average. A golden number is above average; a red number is below average.
One noteworthy thing: none of the Canucks were more than a standard deviation above average in PDO and the closest one was Derrick Pouliot, who won’t be on the team anymore. The upshot is that we shouldn’t see too much downward regression from anyone next season.
Take Bo Horvat, for example: he’s almost exactly average in PDO. His career highs in goals and points weren’t unduly influenced by chance. In fact, his on-ice shooting percentage was a little below average. Perhaps with some better, more consistent linemates and a few bounces going his way, Horvat could have even better offensive production next season.
The highest on-ice shooting percentages belong to Elias Pettersson and Brock Boeser (ignoring Pouliot), which isn’t surprising. Both Pettersson and Boeser have above average finishing ability and Pettersson is an adept playmaker. Are these numbers likely to regress next season?
Perhaps. Pettersson’s on-ice shooting percentage was 1.2 standard deviations above average, but it wasn’t even in the top-70 on-ice shooting percentages in the league. If Pettersson is as good as we believe him to be, any regression should be slight.
On the other end of the scale, we see below-average on-ice shooting percentages from a good chunk of the Canucks, including the likes of Jake Virtanen, Loui Eriksson, Markus Granlund, Adam Gaudette and Brandon Sutter. Perhaps we should expect a slight offensive improvement from those players, though it would be with the Oilers for Granlund.
Then there’s on-ice save percentage. Perhaps we shouldn’t have been surprised that Erik Gudbranson looked better with the Pittsburgh Penguins after he was traded: his on-ice save percentage with the Canucks last season was .890, but went up to .946 with the Penguins. Neither of those numbers is likely to hold fast next season.
That doesn’t mean Gudbranson was good last season — he wasn’t — but the harsh mistress that is randomness and chance made him look even worse.
Finally, let’s look at the Canucks' acquisitions this off-season.
Just one of the Canucks’ acquisitions had a below-average PDO and just barely: Jordie Benn’s .996.
Micheal Ferland, however, could experience some regression next season, as his 1.029 PDO was higher than any Canuck’s last season by a wide margin. He had the highest on-ice shooting percentage of his career at 9.40%, and he might be hard-pressed to repeat that performance with the Canucks. That’s something that might be worth delving into for a future article.
Tyler Myers, at least, was completely average last season in terms of PDO. However well he performed last season, random chance didn’t make him look any better or worse.