
It’s every coach’s nightmare. In the middle of a game, your line-matching goes awry and your fourth-line forwards and third-pairing defencemen wind up on the ice at the same time as the other team’s first line and top pairing.
Suddenly your grinders and pylons are staring down a rush from Sidney Crosby, Nathan Mackinnon, and Connor McDavid, with Brent Burns and Erik Karlsson jumping up in the play. One of your forwards gets turnstiled, a defenceman falls flat on his keister trying to keep up with a quick pivot, and a couple passes later your poor goaltender is turned into a pretzel with the puck in the back of your net.
Pardon the hyperbole, but that’s how it seems sometimes when a bad matchup unfolds on the ice.
Everyone remembers seeing shifts when a fourth line faces a first line and gets pinned in their own end, giving up a series of scoring chances. Or, you might get excited when you see your team’s first line come over the boards for a faceoff after the opposition’s fourth line ices the puck. Those moments of imbalance can lead to some of the best goal-scoring opportunities in a game.
Those shifts also seem to be an illustration of Quality of Competition, a somewhat controversial hockey metric. Quality of Competition (QoC for short) is pretty self-explanatory: it’s meant to be a measure of the quality of an individual player’s competition. In other words, how good are the players that he plays against?
The effects of Quality of Competition seem obvious: we see it any time line-matching goes awry like in the hyperbolic situation above. When a player regularly faces difficult competition — such as, for instance, Brandon Sutter — the natural assumption is that it must have a significant effect on their on-ice results.
Quality of Competition comes up frequently when talking about shot-based analytics like corsi. Corsi, otherwise known as shot-attempt differential, has become more and more mainstream over the years, to the point that shot attempts are frequently referenced on television broadcasts and a version of corsi is on the NHL’s official website. It’s still, in many ways, the gold standard of so-called “advanced” statistics because of its predictive power: it’s more predictive of future goal differential on both a team and individual level than most other metrics.
Corsi still has its detractors, however, with context the main bone of contention. Part of the popularity of corsi is its simplicity — you just add up shot attempts for and against when a player is on the ice at 5-on-5 — but that simplicity means that it doesn’t take into account a player’s context. Who did that player play with? Did his shifts start in the offensive or defensive zone? And, for some people the most important factor, who did that player play against?
Here’s the issue: most hockey analysts have come to the conclusion that Quality of Competition doesn’t matter anywhere near as much as people think it does.
“It matters, on average, about three or four times less than quality of teammates does,” said Micah Blake McCurdy, “even after you take into account how you have five opponents at 5v5 but only four teammates.”
McCurdy is a PhD in mathematics and runs the website Hockey Viz, where he provides data visualisations rather than numbers. As he said in his talk at the Vancouver Hockey Analytics Conference, “Numbers are boring, pictures are awesome.”
His visualizations are, of course, made of numbers — hundreds or even thousands of numbers in a single image — and that includes Quality of Competition numbers. For instance, here is a visualization of Brandon Sutter’s Quality of Teammates (QoT) and Quality of Competition, showing how frequently he faced forwards or defencemen with the first, second, or even twelfth most ice time on their team.
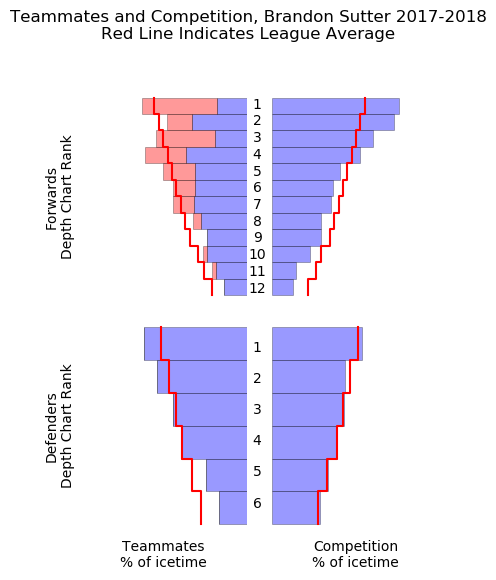
That visualization shows that Sutter faced an opponent’s first line more than the average represented by the red line. McCurdy, however, downplays the importance of Quality of Competition for several reasons. One of the biggest is that its impact is so much smaller than the impact of Quality of Teammates.
“You shouldn't ever be allowed to talk about a guy's competition without making a quantitative comparison to his teammates,” said McCurdy. “I don't think you can say anything fairly unless you observe that rule of thumb.”
“Shift by shift, [Quality of Competition] is very meaningful; it's the aggregate patterns that average out,” he added. “Coaches are much more consistent with their lines than with their matchups, partly by necessity. Your linemates are all from one team (basically, not counting trades) and your opponents are from 30.”
It makes intuitive sense: you’re far more likely to play with the same quality of linemates than you are the same quality of opponents, because a coach has direct control of the former and only indirect control of the latter.
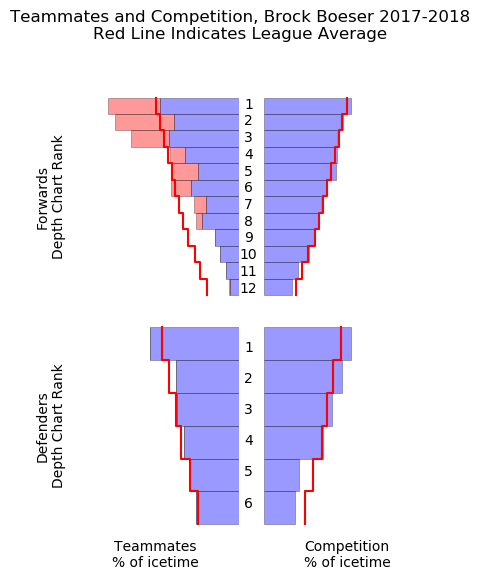
Consider Brock Boeser. The Canucks’ young star played over 844 minutes at 5-on-5 last season; over 322 of those minutes were played with the same two linemates: Bo Horvat and Sven Baertschi. When he wasn’t with both of those players, he was still playing with other top-six forwards. Any time that he spent on the ice with third or fourth-line players was largely incidental, such as during line changes. That’s going to result in some very consistent quality of teammates.
Shift after shift, Boeser came on the ice with the same linemates, but the players he was facing changed constantly. He faced first, second, third, and fourth lines at a league average rate, as illustrated by McCurdy’s visualization.
We can see it in the numbers as well as the visualizations. If we look at the entire NHL and look at the most extreme ends of the spectrum when it comes to Quality of Teammates and Quality of Competition, we can see that there’s a much wider spread in Quality of Teammates.
One of the methods of measuring this is Time On Ice Percentage (TOI%): the percentage of a team’s total ice time that a teammate or opponent plays. The assumption is that if a coach puts a player on the ice a lot, he must be a good player.
The lowest Quality of Teammates as measured by TOI% from last season belonged to Alex Petrovic, defenceman for the Florida Panthers, at 25.43%. The highest came from Colorado Avalanche forward Mikko Rantanen at 32.37%. To put it into ice time, the average teammate for Petrovic played about 12:30 at 5-on-5 per game, while the average teammate for Rantanen played about 15:38.
That’s over a three-minute gap in ice time, which doesn’t seem like much, but it’s significant compared to the variation in Quality of Competition.
The lowest Quality of Competition as measured by TOI% belonged to Maple Leafs enforcer Matt Martin at 27.04%. The highest: Anze Kopitar at 30.08%. That’s a spread from about 13:04 to 14:32. That’s less than half the gap as compared to Quality of Teammates.
Since Quality of Teammates varies more than Quality of Competition between players, the effect of the strength of your teammates will be stronger.
Another reason why Quality of Competition doesn’t show up as much in the data is because tougher competition tends to go hand-in-hand with other factors.
“It turns out that the two main things that are considered ‘tough’ usage - defensive zone starts and playing against tough competition - happen at the same time very often,” said McCurdy, “so when you isolate the effects of the two from one another, neither one is quite as big as you might expect.”
Essentially, if you take into account a player’s zone starts, you’ve already accounted for most of the effect of Quality of Competition. If you weight both factors equally, you’re at risk of double counting.
Additionally, players with difficult competition more frequently player with better teammates. More often than not, first lines face first lines, partly because coaches frequently lean towards playing power against power, but also because the best players are on the ice more often and will, by happenstance, play against each other more often.
“Generally, a player who faces higher Quality of Competition also plays with the best linemates on their team,” said Josh and Luke Younggren, the twins behind the analytics site Evolving Hockey.
“This is an important point to understand,” they said. “It’s not like competition is a separate impact on player result. The teammates a player plays with are far more important to account for than the competition that a player faces. They go hand in hand, but from what we’ve seen, teammates are far more significant.”
The Younggren’s new Evolving Hockey site includes their version of Wins Above Replacement (WAR). A WAR model attempts to measure how much better a player is than a “replacement-level” player — ie. a player that could be claimed off waivers or called up from the AHL. Goals Above Replacement (GAR) measures how much better that player is in goals, while WAR measures it in wins.
While WAR models owe a debt to baseball, the genesis of the Younggren’s model actually comes from basketball. Their model is based on Regularized Adjusted Plus Minus (RAPM), a model that has worked well in basketball, which has used variations on statistical plus-minus for years.
“We do not specifically include a measure of Quality of Competition in our WAR model,” said the Younggrens. “This is for many reasons, but we feel the current methods are somewhat problematic. Also, the specific technique that we used - a statistical plus-minus approach - requires a long-term dataset (we used 11 years) for training the models. Basically, at that point, Quality of Competition effects have been significantly washed out.”
“We do include a TOI% variable (percentage of available minutes a player played),” they added. “This is similar to basketball’s Box Plus-Minus and can be interpreted as a proxy for Quality of Competition, we think. That variable was very significant in most of the models.”
The decision to exclude Quality of Competition wasn’t made randomly; they simply found that it wasn’t significant enough to include. Another issue is that the current methods of measuring Quality of Competition are, as they say, problematic.
The two main ways to measure Quality of Competition are by ice time and by corsi.
“I like to use ice time myself and I've used it in the past,” said McCurdy. “It amounts to trusting coaches, which is obviously appealing because a) coaches are mostly smart and b) it's not going to be tied up with other factors which are going to complicate your analysis.”
“On the other hand, we know that coaches aren't always smart,” he added, “and assuming that a 25 minute-a-night defender on a bad team is the same quality as a 25 minute-a-night defender on a strong team is also obviously wrong in a way that there isn't an easy fix for.”
The issue with using corsi is that you risk begging the question. Does a player put up a good corsi because he is good or because the players he faces are bad? If someone has a bad corsi while facing players with a good corsi, who is responsible: the player or his opponents? The difficulty inherent in splitting up who is responsible makes it extra problematic.
Both McCurdy and the Younggrens agree that time on ice isn’t a perfect method for measuring Quality of Competition and both suggest the best way to account for those contextual factors like competition is a regression method.
“The best way to account for Quality of Competition effects would be to include it in a regression, similar to Manny Perry’s WAR, or the RAPM regressions that we have used,” said the Younggrens. “In this setting, everything is measured/accounted for at the same time.”
Since their WAR model, based on their RAPM regressions, doesn't specifically use a Quality of Competition metric, some might be skeptical that a model that it could accurately rate someone who faced difficult competition like Brandon Sutter. It’s worth noting that their model had Sutter as the fourth-most valuable player on the Canucks last season behind Bo Horvat, Brock Boeser, and Chris Tanev.
“I think the only way to really measure competition properly is to measure overall ability at offence or defence for everybody on the ice all at once,” said McCurdy. “In other words, to start with a blank slate of ideas about which players are good and let each shift update your opinion of which players are strong or weak. The only tool I know to do this without introducing analyst bias is regression, which is transparent enough mathematics but still complicated enough to scare some people off.”
Regression definitely scares some people off, but McCurdy repeatedly emphasized that it’s not as complicated as it seems. At one point he referred to it as regressin’, which gave it a certain folksy charm.
“Regression is just drawing a line of best fit through a bunch of points,” said McCurdy. “If the points were on a piece of paper a dextrous four-year-old could do a job which wouldn't be markedly worse than you'd do with a computer. A typical NHL season has about nine hundred different skaters in it and you probably want to model defence and offence separately, so when you move from two dimensions to eighteen hundred dimensions, the computer starts to help a lot. But it's still just drawing a best fit line through data.”
Since there are so many data points in hockey, you end up doing “geometry in high dimensions,” said McCurdy, but the actual task of drawing a line of best fit remains the same. McCurdy compared it to digging a ditch on Mars: “It's not easy to get there, but once you figure that out, the work itself is really very boring.”
“This is also why I bristle at people who call regression ‘a black box,” he added. “If you say ‘What's in the box?’ and I say, ‘Oh, all sorts of things! Let me tell you all about them! It might take a while," and you say, "No, I don't want to listen,’ and then tell people that there's no way to know what's in the box: that's infuriating.”
In fact, most of the publically available WAR models do have comprehensive writeups or conference presentations that explain how they produced their model and all of the data and assumptions that go into them. While some of the technical aspects of these writeups or presentations is difficult to understand for those without a background in statistics and/or mathematics, transparency generally isn’t an issue.
Ultimately, the work that has gone into these models, as well as work independent of WAR models, seems to have come to a similar conclusions: Quality of Competition just isn’t that important. Or, to put it another way, it’s not that Quality of Competition doesn’t matter; it’s just that other factors matter a lot more.
It’s hard, however, to dismiss the eye test that suggests the opposite is the case. This seems to be a case of the micro versus the macro. On a micro level — looking at a single shift, a single game, or even a few games in a row — of course Quality of Competition matters. We can see it with our eyes and we can see it in the numbers.
On a macro level — over the course of a full season or across multiple seasons — the effects of Quality of Competition fade. It may be hard to pinpoint why, but that doesn’t change the data. Perhaps it’s because a coach can’t get those ideal matchups consistently over the course of an entire season. As much as a coach might want perfect line-matching at all times, that’s an impossible goal.
“If coaches had perfect control and always played power on power and schmuck-vs-schmuck, you'd have a harder time [doing regression analysis],” said McCurdy, noting that you need a good mix of players playing together for regression to work.
“Mercifully,” he added, “hockey is chaotic enough to allow for good data analysis.”