TransLink ridership rebounded to 75% of its pre-pandemic levels by the fall of last year, according to a new report. This growth came after ridership dropped to 48 per cent in January 2022, sliding from a previous high of almost 65% in late 2021.
Metro Vancouver’s ridership rebound outpaced that of major metropolitan areas in Canada and the U.S. which have only returned to roughly 48 per cent and 56 per cent of their pre-pandemic levels respectively.

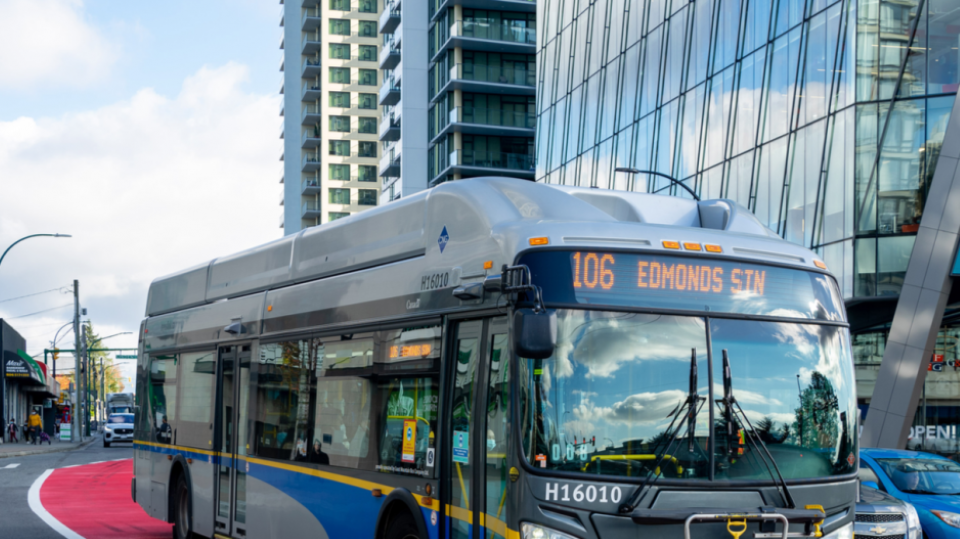
Today TransLink released its annual bus speed and reliability report which highlighted additional traffic delay costs incurred by the Coast Mountain Bus Co. (CMBC). TransLink CEO Kevin Quinn emphasized that these additional costs underscore the need to invest in bus infrastructure as laid out in TransLink’s 10-year plan released in early 2022.
“With congestion returning to our roads, it’s more important than ever that we prioritize bus service, continue to invest in transit, and meet the needs of our growing region," said Quinn.
Buses make up 63% of TransLink boardings and have recovered faster than other modes of transportation including various SkyTrain lines and the SeaBus.
Unfortunately, when buses are running 10 minutes late due to traffic, not only does it add an additional 20 per cent to rider travel time, but it costs CMBC an additional $80 million a year or roughly 15% of its total budget. This is because to maintain the same level of service with buses running 10 minutes late, CMBC needs to have six drivers, six buses and 360 minutes of driver time for a route that would usually take five buses, five drivers and 250 minutes of driver time.

Pandemic restrictions and remote work shifted travel patterns and caused buses to briefly run faster in early 2020, however, overall bus delays have returned to levels that are the same or worse than before the pandemic. By fall 2021, bus delays mirrored what they were in 2019, before the pandemic, and were three per cent higher than the previous year in 2018.
Every year, TransLink adds over $2 million of services to offset the impacts of traffic. These adjustments have added up to $7 million to operating costs each year, which the report says is comparable to the operational cost of introducing a new RapidBus route every 2 years. It cost $28.6 million to counter delays from increased traffic in 2022 relative to 2014 levels with a cumulative cost $155.4 million over the past nine years.
Delays exist across the region; buses collectively are delayed more than 2,400 hours each day and riders are delayed by over 28,000 hours. Delays are concentrated in retail areas and particularly in the Vancouver-UBC corridor as well as Surrey and central Richmond.
The report highlights that there are relatively simple things cities can do to encourage people to shift their transportation mode, take public transit and ultimately avoid traffic delays. One example is the reallocation of road space to provide safer facilities for cycling or walking.
The report also highlights ways cities can protect against traffic congestion such as widening roads to add bus or HOV lanes or a potentially less expensive option is to convert general travel lanes or parking lanes into bus lanes.
However some of these ideas come with political difficulties and the report suggests that an agency alone cannot successfully deliver a plan for bus priority and that cooperation from different authorities, stakeholders and communities will be needed to improve Metro Vancouver’s bus system.


